Mastering Price Action: How Auction Market Theory Decodes Volume, Time, and Market Profile for Advanced Traders
Introduction to Auction Market Theory
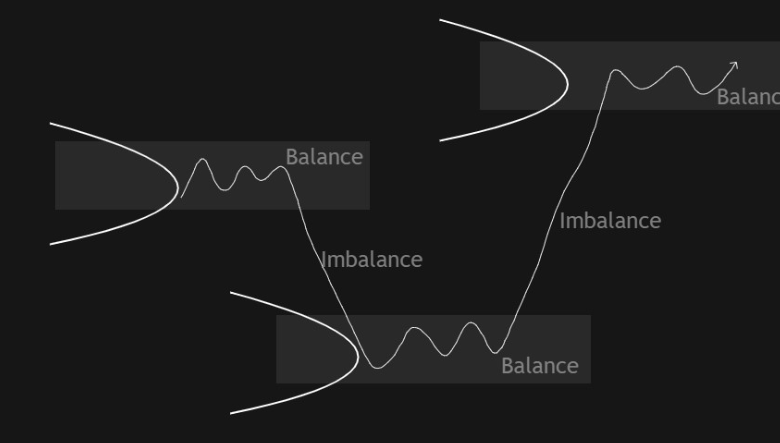
Auction Market Theory (AMT) provides a framework for interpreting market behavior through the lens of supply and demand dynamics. This approach is rooted in the belief that financial markets operate similarly to auction houses, where buyers and sellers interact to establish prices based on their perceived value of an asset at any given moment.
The foundational principle of AMT is that price reflects the collective actions of market participants over time. Advanced traders utilize this understanding to predict future price movements by analyzing how volume, time, and market profiles interplay. By mastering these elements, one can develop a more nuanced trading strategy that increases the likelihood of success.
Understanding Price Action
Price action refers to the movement of an asset’s price over time and is a fundamental aspect of trading strategies. Traders who focus on price action analyze historical price data without relying heavily on technical indicators or other metrics, allowing them to make decisions based solely on market trends.
Key Components of Price Action
1. Trends: Recognizing whether the market is in an uptrend, downtrend, or consolidating phase is crucial for making informed trading decisions.
2. Support and Resistance Levels: These are critical points where price tends to reverse or stall due to an imbalance in buying or selling pressure.
3. Candlestick Patterns: Understanding formations such as dojis, hammers, and engulfing patterns can provide insights into potential market reversals or continuation.
By focusing on these components, traders can decode the behavior of the market and identify opportunities for entry and exit.
The Role of Volume in Price Action
Volume is a vital indicator in Auction Market Theory as it signifies the strength behind price movements. High volume during an upward move suggests strong buying interest, whereas high volume during a downward move indicates strong selling pressure.
Analyzing Volume Data
1. Volume Spikes: Sudden increases in volume often precede significant price movements.
2. Volume Divergence: When price moves in one direction while volume moves in another, it can signal a potential reversal.
3. Accumulation and Distribution: Understanding whether institutions are accumulating or distributing shares can aid traders in determining market sentiment.
Recognizing these volume patterns allows traders to align their strategies accordingly, ensuring they are positioned favorably relative to market dynamics.
Time as a Critical Factor
In financial markets, time plays a pivotal role in shaping price action and influences trader decision-making. Different time frames can reveal various trends and signals, making it essential for advanced traders to appreciate how time affects their analysis.
Time Frames in Trading
1. Intraday: Shorter time frames (minutes to hours) allow traders to capitalize on immediate price fluctuations.
2. Daily: Daily charts provide insight into medium-term trends and are often used by swing traders.
3. Weekly/Monthly: Longer time frames help identify overarching trends and critical support/resistance levels.
By understanding how time frames relate to each other, traders can better align their strategies with prevailing market conditions.
Decoding Market Profile
Market Profile is a tool designed to visualize the distribution of prices over a specific time period, providing insights into how different price levels were accepted or rejected by market participants. This structure helps traders understand where value lies within the market.
Key Elements of Market Profile
1. Value Area: The range of prices where 70 percent of trading occurred during a specified period.
2. Point of Control (POC): The price level with the highest traded volume within the value area, indicating strong interest.
3. Highs and Lows: Identifying the extremes of price movement assists traders in understanding potential breakout points.
By utilizing Market Profile effectively, advanced traders can make informed decisions regarding entry and exit points based on established market value zones.
Integrating Volume, Time, and Market Profile
The interplay between volume, time, and market profile creates a comprehensive framework through which advanced traders can interpret price action more accurately. Recognizing how these elements correlate allows for better risk management and decision-making.
Developing an Integrated Trading Strategy
1. Identify Value Areas: Use Market Profile to determine key support and resistance levels.
2. Monitor Volume Trends: Analyze volume relative to price movements to gauge momentum or potential reversals.
3. Time Frame Alignment: Ensure consistency across different time frames when executing trades for maximum effectiveness.
By integrating these components into a cohesive strategy, traders can enhance their predictive capabilities regarding future price movements.
Practical Application of Auction Market Theory
Implementing Auction Market Theory requires both theoretical knowledge and practical application skills. Traders must be capable of assessing real-time data while making quick decisions based on their analysis.
Steps for Effective Application
1. Set Up Your Trading Environment: Utilize platforms like Bookmap that provide real-time volume data along with effective visualization tools.
2. Conduct Regular Analysis: Continuously assess historical data through price action analysis combined with volume studies.
3. Adapt Strategies Based on Insights: Remain flexible in your approach; adapt strategies based on evolving market conditions rather than sticking to rigid plans.
Traders who adopt this practical mindset will find greater success navigating complex market environments.
Using Bookmap for Enhanced Trading Decisions
Bookmap stands out as an essential tool for traders looking to master price action through Auction Market Theory principles. It offers unparalleled insights into order flow and liquidity while visualizing real-time data that supports decision-making processes.
Features That Enhance Trading Performance
1. Heatmap Visualization: This feature allows users to see areas of liquidity at different price levels, aiding in identifying potential support/resistance zones.
2. Order Book Dynamics: Analyzing changes in order flow provides insights into upcoming market movements before they occur.
3. Historical Data Analysis: Bookmap enables traders to review past performance visually, helping refine strategies over time.
By incorporating Bookmap into their trading toolkit, advanced traders can gain sharper insights into market conditions that traditional methods may overlook.
Case Studies: Successful Implementation of Auction Market Theory
Numerous successful trading strategies have been developed through the practical application of Auction Market Theory principles combined with tools like Bookmap.
Example Case Study 1: Real-Time Trade Execution Based on Volume Analysis
A trader identified a significant increase in volume coinciding with a break above a key resistance level using Bookmap’s heatmap feature. By entering shortly after confirmation from the volume spike, they capitalized on subsequent price movements that aligned with their analysis.
Example Case Study 2: Utilizing Market Profile for Swing Trading
Another trader employed Market Profile techniques alongside traditional candlestick patterns to identify value areas during consolidation phases. This approach allowed them to enter positions at favorable prices while managing risk effectively by observing shifts in volume trends.
These real-world examples illustrate how integrating Auction Market Theory with advanced tools can yield substantial profits while minimizing risks associated with volatile markets.
Future Trends in Price Action Analysis
As technology continues to evolve, so too will the methodologies employed by advanced traders utilizing Auction Market Theory principles. Emerging trends such as artificial intelligence-driven analytics may soon enhance our ability to interpret complex data sets more efficiently than ever before.
Expected Developments
1. Enhanced Visualization Tools: Improved software capabilities will allow for more sophisticated representations of order flow dynamics.
2. AI-Powered Insights: Predictive models could help forecast potential price movements based on historical patterns analyzed at unprecedented speeds.
3. Increased Accessibility: As tools become more user-friendly, even novice traders may begin employing advanced techniques previously reserved for seasoned professionals.
By staying ahead of these trends, traders can continually refine their approaches while maximizing profitability within ever-changing market environments.
Mastering price action through Auction Market Theory requires dedication but offers significant rewards for those willing to invest the necessary effort and resources into understanding its complexities fully. With tools like Bookmap at your disposal, you will be well-equipped to navigate even the most tumultuous trading landscapes with confidence and precision.